

Optimizing a Sales KPI Report in Power BI for Better Sales Visibility
Introduction
Sales teams work with a lot of data every day, including leads, opportunities, activities, quotes, and orders. Most of this data is stored in different modules or systems, which makes it difficult for users to get a complete picture of sales performance.
To solve this problem, we created a Sales KPI Report in Power BI that brings all this information into one place. The report gives users a clear view of the complete sales process, from lead creation to order completion.
In this blog, I will explain how the report was designed, the improvements made, and the business value it provides.
Business Requirement
The main requirement was to create a simple and easy-to-use dashboard that helps users:
- Track overall sales performance
- Monitor leads and opportunities
- Review sales activities and follow-ups
- Analyze quotes
- Understand order trends and conversions
The goal was to give business users quick access to important information without spending time collecting data manually from different screens.
How We Optimized the Report
1. KPI-Based Dashboard Design
The most important KPIs were placed at the top of each page so users can quickly understand the current business situation.
Some of the main KPIs include:
- Total Leads
- Total Opportunities
- Total Quotes
- Total Orders
- New Customers
- Open Activities
- Completed Activities
This helps management get a quick overview before looking into more details.
2. Better Visualizations
Instead of showing only raw data, different visuals were used to make the report easier to understand.
These include:
- KPI Cards
- Donut Charts
- Bar Charts
- Line Charts
- Tables
This makes it easier for users to identify trends and compare performance.
3. Organized Report Pages
The report was divided into separate pages based on business areas:
- Sales Overview
- Activity Summary
- Quotes Overview
- Order Summary
This makes navigation easier and prevents users from feeling overwhelmed with too much information on one page.
4. Interactive Filters
Filters were added to allow users to explore the data based on their needs.
Available filters include:
- Salesperson
- Customer
- Date
- Status
Users can quickly analyse specific information without creating new reports.
5. Improved Performance
To make the report faster and easier to use:
- Unused fields were removed
- Visuals were arranged in a cleaner layout
- Only useful KPIs and charts were kept
This improved both report performance and user experience.
Dashboard Walkthrough
Sales Overview
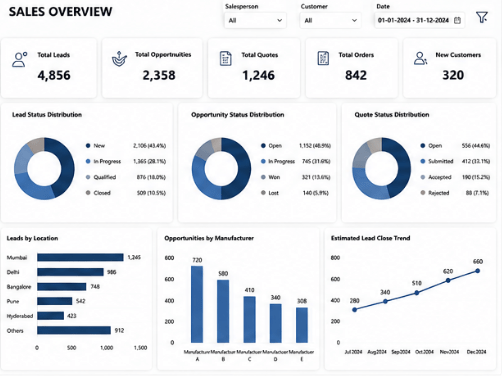
The Sales Overview page gives a complete picture of the sales pipeline.
Some of the key information available on this page includes:
- Total Leads
- Total Opportunities
- Total Quotes
- Total Orders
- New Customers
- Lead Status Distribution
- Opportunity Status Distribution
- Quote Status Distribution
- Lead Location Analysis
- Opportunity Analysis by Manufacturer
- Lead Closing Trends
Why this page is important
This page gives management a quick understanding of sales health.
It helps answer business questions such as:
- Are leads being generated consistently?
- How many leads are progressing into opportunities?
- How many opportunities are being converted into quotes?
- Which areas or manufacturers are contributing more?
This page acts as the entry point for the entire report and supports high-level business monitoring.
Activity Summary
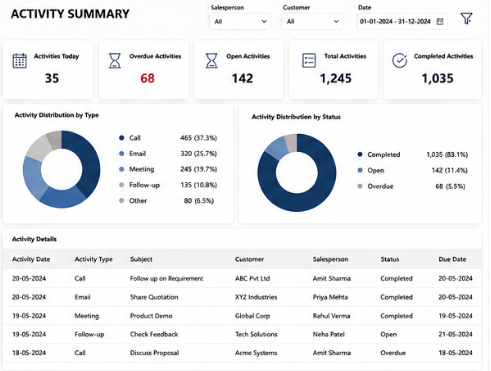
The Activity Summary page focuses on sales activities and follow-ups.
This page includes:
- Activities Today
- Open Activities
- Completed Activities
- Overdue Activities
- Activity Distribution by Type
- Activity Distribution by Status
Why this page is important
Sales success depends not only on leads and opportunities, but also on consistent follow-up activities.
This page helps business users and managers understand:
- Whether activities are being completed on time
- Which type of activities are most common
- Whether there are pending or overdue follow-ups
- How actively the sales team is engaging with prospects
This makes the report useful not only for performance tracking, but also for sales discipline and accountability.
Quotes Overview
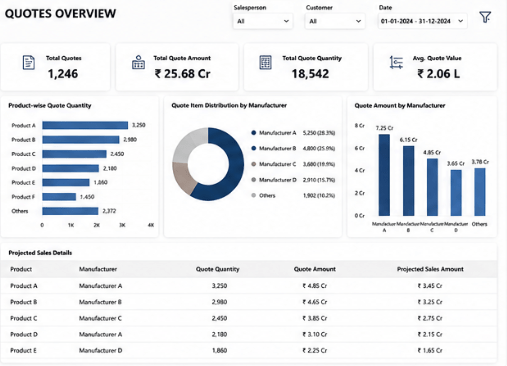
The Quotes Overview page provides visibility into quotations and future sales opportunities.
The page includes:
- Product-wise Quote Quantity
- Quote Amount by Product
- Manufacturer-wise Quote Distribution
- Projected Sales from Quotes
Why this page is important
This page helps the business understand what is being quoted and where future sales potential exists.
Order Summary
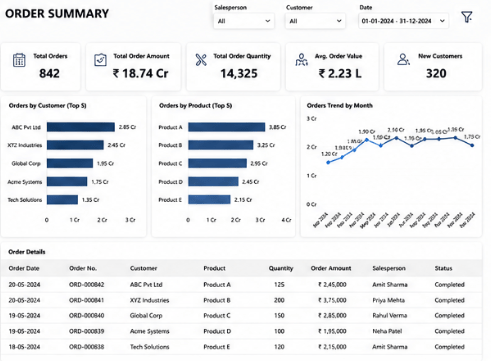
The Order Summary page focuses on completed sales and actual business revenue.
Some important insights include:
- Orders by Customer
- Orders by Product
- Monthly Order Trends
- Sales Amount Analysis
- Detailed Order Table
Why this page is important
This page helps the business measure real sales output, not just pipeline activity.
Business Benefits
After implementing this Sales KPI Report, the business gained:
- A single place for all sales reporting
- Better visibility into the sales process
- Faster access to important information
- Improved tracking of activities, quotes, and orders
- Better decision-making using interactive reports
- Less dependency on manual reporting
Conclusion
The Sales KPI Report helped transform scattered sales data into a simple and easy-to-understand reporting solution.
By organizing the report into separate business areas and using meaningful KPIs and visuals, users can quickly monitor sales performance and identify areas that need attention.
Overall, this report has improved visibility into the sales process and helped users make better business decisions using data.
References
The report design and optimization approach were inspired by Power BI reporting best practices and Microsoft documentation, including:
- Power BI Dashboard Design Best Practices
- Power BI Data Visualization Best Practices
- Power BI Performance Optimization Techniques
- Power BI Interactive Filtering and Slicers
- Microsoft Power BI Documentation
